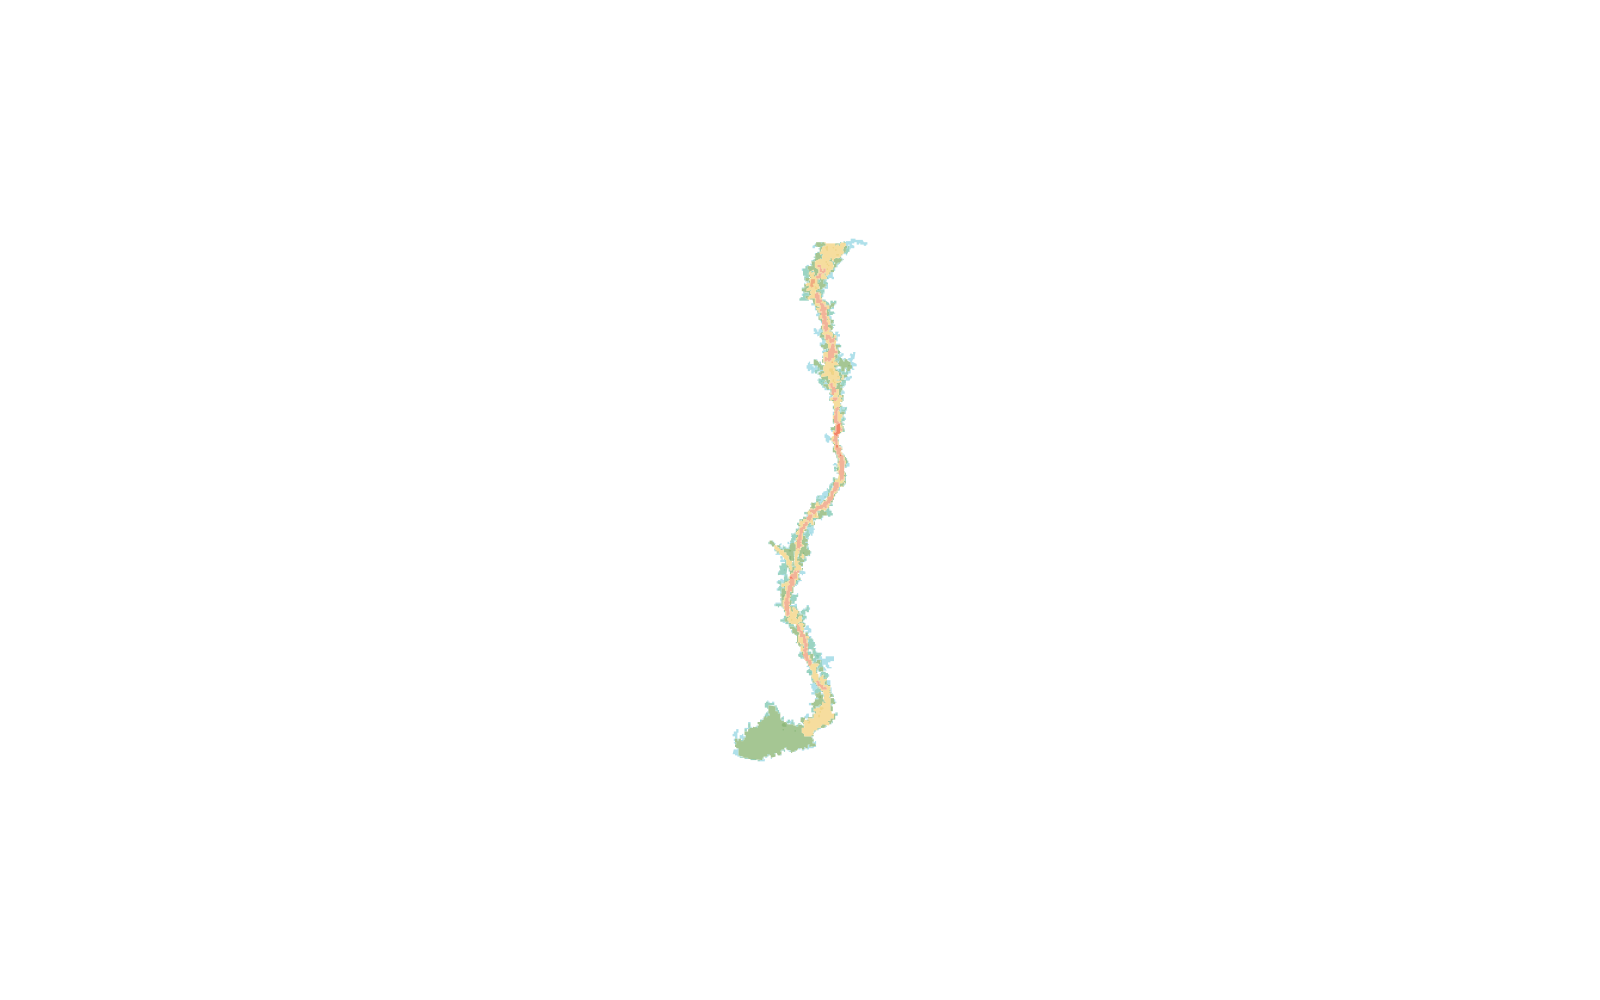
Accepted consequence, flood progression and evacuation-screening evidence.
District JamnagarDam ID GJ217MH0719
—
Population at risk (PAR)
—
Villages affected
≥404.14
Potential Consequence Index · Class III (Significant) or higher
—
Routes crossing water
Tier-1 screening — reviewed planning evidence; not a live warning. Decision values come from the accepted authority tables; maps provide spatial context.
Regional contextSelected dam in Gujarat
Selected dam
Downstream model areaAccepted hydraulic study footprint
Inspect the accepted flood surface and the screened evacuation network in one
coordinate-aware workspace. Every mapped settlement boundary is clickable for its village
statistics; routes expose their screening evidence. Switch basemaps, zoom, pan, or work full-screen.
⌕
Optional layers
Mapped locations · operational status not assessed
Village focusSelected village
Accepted flood replay
At the accepted event reference
0 village boundaries reached
N ↑10 km
Operational topo · exact accepted depth on hover
Flood-depth timelineEAP-guiding flood · selected accepted model outputs
Time replay is available for Design-flood main-embankment piping breach. Your selected comparison case remains unchanged.
Choose Time replay or use a playback control
—Piping-breach initiation · 0 h—
Timeline speed
Maximum depth. The accepted maximum-depth map is displayed. Use play, step, the slider, or a milestone to enter Time replay.Decision overlays use accepted maximum and arrival evidence
Playback from accepted model results · not live conditions.
Potential Consequence Index
Governed refreshed Potential Consequence Index (PCI) lower bound. Class boundaries are shown at 300 and 600; missing records are disclosed and the final score may be higher. Boundary position:
Warning time against exposure
Flood arrival relative to piping-breach initiation (x) against population at risk (y);
dashed lines are the medians. Upper-left is the priority quadrant. Point size is total
village population, colour is worst hazard class. Click a point to zoom to that village and open its information panel. Log population is the default so lower-PAR villages remain legible; exact PAR is unchanged in hover and tables.
Y-axis
Cumulative population at risk
How quickly population becomes at risk along the selected scenario timeline. Each step
is a village reaching its arrival time; the interactive form of the EAP’s exposure
curve. Hover for the village; click a point to zoom and open its information panel.
Hazard-class shares
A 100% composition view across the six CWC hazard classes for the twelve
most exposed villages. PAR is printed at right; hover for exact counts and click to zoom and open village information.
Discharge along the flood path
Peak signed discharge at the current C1–C5 fixed downstream section cuts.
Hover a section for its peak and event-relative time. This technical-review layer is shown
only when its scenario HDF fingerprint matches the current DSS authority.
Evacuation routes
Maximum-depth screen locked to the EAP-guiding Design-flood main-embankment piping breach. The bands describe
mapped-road intersection, not departure state or passability. Hover for exact counts.
Villages
Click a row to zoom to the village and open its flood-impact and evacuation information. Population split is across the
six CWC hazard classes; PAR is classes H3–H6. The default order is PAR ↓; list position is not downstream sequence or flood-arrival order.
 AIReSQ ClimSolsFloodResQDam Decision Support System